
How to Become a Football Data Analyst: What the Job Really Involves
Football data analysts work across recruitment, performance and scouting, turning large datasets into evidence that clubs can actually use. Here is what the job involves and what it takes to enter the field.
This article was originally written in English .
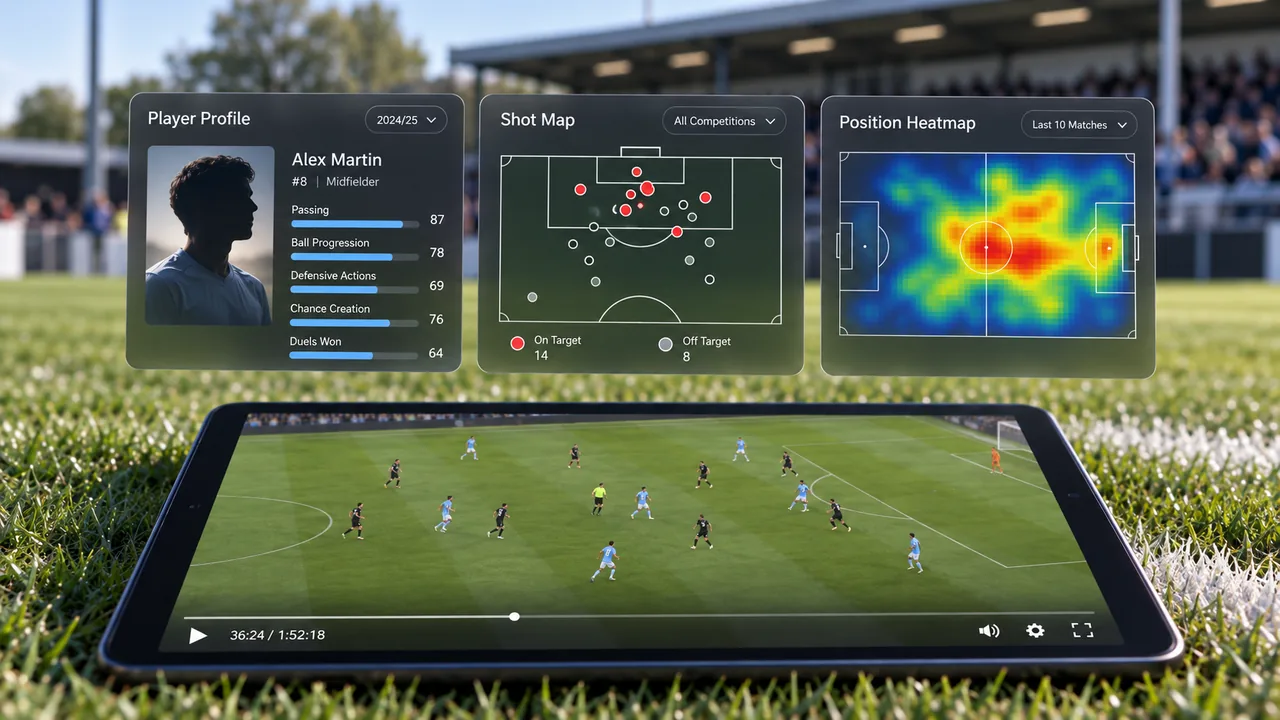
Football has never been short of numbers. Goals, assists, shots, possession and passing percentages have been part of the game for decades. What has changed is the amount of information available to clubs, and how far that information now reaches into recruitment, coaching, performance and squad planning.
A professional match can generate thousands of recorded actions. Depending on the systems a club has access to, analysts may also be able to see where every player was standing, how quickly they moved, which passing lanes were open, how compact a defensive block was, where a press began to break down and what happened away from the ball before a chance was created. Add several seasons of player data, video, scouting reports, training information and physical testing, and there is far more material than any coach or scout could reasonably work through on their own.
A football data analyst helps turn that material into something useful. That might mean finding players who fit a recruitment brief, investigating why a team has stopped creating good chances, comparing the physical demands of different competitions or checking whether something noticed on video is actually happening often enough to matter.
Much of the job is less dramatic than the public image of football analytics suggests. An analyst is not spending every day discovering undervalued wonderkids or building models that tell a club who to sign. A lot of the work is about asking a sensible question, finding the right data, checking whether it can answer that question and being honest about what it cannot tell you.
What does a football data analyst actually do?
There is no standard version of the role. A football data analyst can sit inside recruitment, first-team performance, sports science, an academy or a broader football strategy department. At a large club, those areas may have separate analysts, data scientists and engineers. At a smaller club, one person can end up doing parts of several jobs.
A recruitment analyst might spend a week comparing players across leagues, maintaining search tools, working through possible replacements for a squad member or helping scouts decide which names deserve closer attention. Someone working with the first team may be looking at chance creation, build-up patterns, pressing, defensive transitions or the next opponent. An analyst closer to sports science may spend more time with GPS data, sprint loads and the physical demands placed on individual players.
This is why job titles can be misleading. Two clubs can advertise a "Football Data Analyst" role and mean very different things. One may want strong Python and SQL skills. Another may expect a mixture of video analysis, dashboards and recruitment support. A third may sit much closer to performance science. The responsibilities are more useful than the title when you are trying to understand a vacancy.
Most good analysis begins before anybody opens a notebook or writes a query. It begins with the football problem.
Suppose a club wants a new left-back. That sounds simple until the recruitment staff start defining the role. Is the player expected to stay wide and attack the outside? Move into midfield when the team has the ball? Defend large spaces behind a high press? Carry the ball through pressure? Provide repeated overlaps? Play as a wing-back as well as a full-back? Does the team need recovery speed more than crossing volume?
Those decisions determine what should be measured. If the brief is vague, more data usually gives you a more complicated version of the same vague question.
Once the role is clear, the work becomes more technical. Information from different providers may need to be cleaned and joined. League strength may need to be considered. Playing time, possession and team style can distort raw comparisons. The analyst may build a model, but the answer just as often comes from fairly ordinary statistical work, careful checking and a lot of time spent making sure the comparison is fair.
The last part is communication. Coaches and scouts do not need to inspect the code behind an analysis. They need to know what the analyst found, how confident they should be in it and what is worth looking at next. Sometimes that means a dashboard. Sometimes it is a short report. Sometimes the most useful output is one chart and a conversation.
The data behind modern football
"Football data" covers several different things. The most familiar is event data, which records actions during a match: passes, shots, carries, tackles, interceptions, pressures, duels, fouls and other on-ball events. Those records can include where the action happened, where the ball went, whether it succeeded and other information surrounding it.
This is the basis for much of the analysis people now recognise. Expected goals, expected assists, progressive passes, progressive carries, shot maps, passing networks and penalty-area entries all rely on structured event information.
Event data is useful, but it only captures part of the game. A forward can make a run that takes two defenders away and creates space for a team-mate without touching the ball. A midfielder can close a passing lane for several seconds without recording a defensive action. A centre-back may decide against playing into midfield because the receiver is tightly marked; the sensible decision is made precisely because the pass never happens.
A great deal of football takes place between recorded events.
Tracking data adds another view by recording the positions of players and the ball repeatedly throughout a match. With it, analysts can study spacing, team width, defensive line height, off-ball runs, player separation, pressing structures and the options available to the player in possession. Instead of asking only whether a pass was completed, it becomes possible to ask how difficult it was, how much pressure surrounded the player and what other choices were available.
There is also physical data. Total distance, high-speed running, sprint distance, peak speed, accelerations and decelerations can help describe the physical demands of a role. This is important in performance work, but recruitment departments use it too. A player may look technically suitable for a team while lacking the physical profile required to perform the role that team has in mind.
Inside a club, the picture can become much broader again. Analysts may work with GPS records, training loads, medical and availability information, scouting grades, academy assessments, contract details and internal notes collected over several seasons.
The challenge is rarely to use as much of this information as possible. It is to work out which part of it helps with the question in front of you.
Why context matters more than a long list of metrics
It does not take long to learn the language of football analytics. xG, xA, PPDA, field tilt, possession value, progressive passes and dozens of provider-specific metrics are all easy enough to find. The harder part is learning when a number is telling you something useful and when the context is doing most of the work.
Expected goals is a good example. An xG model estimates how likely a shot is to become a goal, using information such as location and angle and, depending on the model, other details around the attempt. Providers build these models differently, so the same shot can receive slightly different values.
The point of xG is not the decimal number attached to a shot. It gives analysts a way to separate the quality of chances from the outcome.
Two strikers might both score 15 goals. One may be getting into excellent positions every week and finishing at an ordinary rate. The other may have scored several difficult chances from a much weaker set of shots. The goals column treats the seasons as equal. The underlying performances are not necessarily the same.
The same problem appears with simpler statistics. A centre-back completing 94 per cent of his passes might be an excellent progressive passer, or he may spend most of the match making short, low-risk passes. A winger with high progressive-carry numbers might be exceptional at beating opponents, or he may play in a transition-heavy team that gives him open space several times a match. A midfielder with huge defensive numbers may be dominant without the ball, or simply play for a team that rarely has possession.
Per-90 figures help with playing time, but they do not solve the underlying problem. Possession matters. Scoreline matters. Role matters. Team strength matters. The manager's instructions matter. The league matters.
Manchester City's recent recruitment work offers a good illustration. In September 2026, reporting on the club's process showed that City do not treat every full-back as one type of player. They separate profiles, including more defensive full-backs, players who move inside and players who operate high and wide. That distinction comes before any comparison of output. The club first decides what the role is, then looks at the data that is relevant to it. BBC Sport's report on Manchester City's recruitment process.
That is a much more useful picture of professional football analytics than putting two radar charts side by side and deciding who has the larger shape.
How clubs use data in recruitment
Recruitment is the easiest place to see why clubs employ data analysts because the problem is so large. No scouting department can watch every professional player in every relevant competition. Clubs need ways to decide where to spend their time.
Data is one of those filters.
The Manchester City example is unusually revealing. According to the 2026 report on the club's recruitment operation, the starting database contains roughly 650,000 players. Once the recruitment team has agreed the profile it wants, analytical filters can reduce that pool to a longlist of around 20 to 50 names. That list is then cross-checked against scouting work and reduced further before the club carries out deeper assessment. BBC Sport.
The number is striking, but the order of the process matters more. Somebody has to define the target before the filters make sense, and the data does not make the final decision afterwards. City's sporting director Hugo Viana stressed in the same report that data is only one part of the picture, because it cannot fully describe qualities such as character, mentality and behaviour.
A second City example became public through the club's documentary A Beautiful Obsession. During the work around finding a player who could take on some of Kevin De Bruyne's creative responsibilities, City's analysts describe measuring 43 metrics across the pitch, reducing them to seven numbers and using those to group similar player profiles. Rayan Cherki appears in the discussion as a player who could develop towards De Bruyne's profile, and City later signed him. Manchester City's official page for A Beautiful Obsession.
The useful part of that scene is not trying to guess City's exact model. We do not know the club's 43 variables, their weighting or the full method behind the comparison. What the example shows well is the work required before a similarity search becomes meaningful.
"Find the next Kevin De Bruyne" is not a usable analytical brief. Which parts of De Bruyne's game matter for the role the club is trying to fill? Chance creation? Passing into the final third? Ball progression? Carrying? Shooting? Receiving positions? The ability to play through pressure? How much weight should each of those things carry?
An analyst has to help turn the football description into measurable criteria. The shortlist comes later.
This is why recruitment analysis is usually more useful when people stop imagining it as an automated transfer system. Its value is often in cutting an impossible search down to a group that scouts and recruitment staff can examine properly.
Performance, tactics and opposition work
Not every football data analyst works on transfers. Some spend most of their time much closer to the weekly problems of the team.
Imagine a side that has started creating fewer chances. The obvious statistics may show that shot volume has fallen, but that does not explain why. An analyst might look at how often the team reaches the final third, which routes it uses to get there, whether key midfielders are receiving under heavier pressure, whether full-backs are progressing the ball less often or whether opponents have changed the way they defend the build-up.
A defensive question might need a completely different set of information. How often is the first line of pressure broken? What happens immediately afterwards? Is the midfield arriving late to second balls? Are opponents repeatedly finding the same space? Has the defensive line dropped deeper over the last month?
This work is often strongest when data and video are used together. Video can suggest a pattern. Data can show whether it happens often enough to deserve attention. The reverse works too: an unusual number may give the analyst something specific to look for on video.
Opposition analysis follows the same logic. A coaching staff rarely benefits from being handed every available statistic about the next opponent. The useful questions are narrower. How do they build from goal kicks? Which player becomes important when they are pressed? Do they prefer one side when escaping their defensive third? Where do they tend to lose the ball? What situations lead to their best chances?
There is plenty of overlap here with performance analysis. Traditionally, performance analysts have worked more closely with video, match coding and tactical presentation, while data analysts have worked more with structured datasets, statistics and modelling. In modern clubs, the boundary is often much less tidy. Analysts in both areas need to understand enough of the other's work to have useful conversations.
The technical side of the job
Football is the subject, but this is still a data profession.
SQL is valuable because professional organisations store large amounts of information in databases. Analysts need to find the right records, combine tables, filter data and write queries that can be repeated without rebuilding the same work by hand every week.
Python is common across football analytics and data science. R also has a strong football analytics community. Both can be used to clean data, automate tasks, run statistical analysis, build models and create visualisations. There is little value in collecting programming languages for a CV; being able to use one of them confidently on messy real-world data is far more useful.
Excel remains part of the job too. Quick checks, recruitment lists and one-off requests still end up in spreadsheets. Power BI and Tableau are common where a club wants dashboards that coaches, scouts or executives can use without touching the underlying code.
Much of the work is less glamorous than the final chart. Player names have to be matched across providers. Competitions change names. Records go missing. A supplier changes a field and a query that worked yesterday suddenly breaks. Someone finds a duplicate. A dashboard has been showing the wrong filter for a week.
These are ordinary data problems, and football has all of them.
Statistics matters for the same reason. An analyst should be comfortable with averages, distributions, variance, percentiles, probability, correlation, sample size and uncertainty. Football produces noisy outcomes and small samples constantly. A player can have a remarkable six-week run that tells you very little about the next two years. A team can play well and lose. An underlying metric can be useful without being a perfect description of reality.
More advanced work may involve regression, classification, clustering, dimensionality reduction or machine learning. Computer vision has expanded the field further by allowing positional information to be extracted from video.
None of that makes a complicated method automatically better. A simple analysis that answers the question clearly is more useful than an advanced model built because the analyst wanted an excuse to use one.
How much football knowledge do you need?
Enough to know when the data is missing the point.
An analyst does not need to have played professionally or worked as a coach, but it is difficult to interpret football data well without understanding the game. Tactical context changes numbers all the time. A winger's output can rise because his role has changed rather than because the player has improved. A midfielder can become less progressive after joining a stronger team because somebody else now advances the ball. A centre-back can make fewer defensive actions because his team spends far more time in possession.
The numbers do not explain those changes on their own.
The opposite problem is just as common. Someone can understand football very well and still lack the statistical or technical skills needed for data work. Coaching knowledge does not teach SQL. Years of watching matches do not make someone comfortable with probability, sampling or data cleaning.
People enter the field from both directions. Some come from football and add the technical side. Others arrive from mathematics, computer science, engineering, economics, finance or other data-heavy industries and have to build their football understanding.
For someone coming from outside the game, watching matches alongside the data is one of the most useful habits to develop. If a player looks unusual in the numbers, watch him. If two players appear almost identical statistically, watch both and find where the similarity breaks down. If a metric changes sharply after a transfer or a change of coach, go back to the matches.
Over time, you start to recognise which parts of football the data captures well and which parts need more caution.
Do you need a degree, and how do you get started?
There is no single qualification that makes someone a football data analyst. Degrees in statistics, mathematics, computer science, data science, engineering and economics can all provide useful foundations. Sports science and performance-analysis graduates also move into data roles, particularly when they add programming and statistics to their existing football knowledge.
Some employers ask for a relevant degree. Others care more about practical evidence. Can you handle a large dataset? Can you write clean, reproducible code? Do you understand basic statistical ideas? Can you explain why you chose a metric? Does the analysis make sense when somebody watches the football?
More research-heavy data-science roles are more likely to favour postgraduate study, but football analytics as a whole does not have one fixed academic route.
It is also one of the areas of professional football where you can build credible work before a club gives you access to its internal systems. Public datasets make that possible. Hudl Statsbomb, for example, publishes open event data for a selection of competitions and provides resources for working with football data in Python and R. StatsBomb Open Data.
A useful portfolio does not need to be enormous. One carefully designed project can say more than ten versions of the same player radar.
Start with a football question rather than a visualisation. Which midfielders progress possession in a particular way? Has a team's chance creation changed since a coaching change? Which strikers repeatedly arrive in high-quality shooting positions? How would you search for players suited to a very specific tactical role?
Then show the reasoning. Explain why you chose the question, what the data contains, what it misses and why you selected those metrics. Check surprising results. Watch video where possible. If the analysis has weaknesses, say what they are.
This is much closer to the work a club needs than simply showing that you can produce a polished graphic.
Publishing the work can help. A personal site, GitHub repository or well-written analysis gives recruiters something concrete to inspect. It also gives people inside football something they can discuss with you. Knowing Python is useful; showing how you use it to think through a football problem is more revealing.
What is the job actually like?
Not every week is spent searching for the next signing.
There will be data cleaning, urgent requests, dashboards that need changing, queries that stop working and analyses that lead nowhere. You can spend hours on an interesting pattern and then find that it disappears once one data issue has been corrected. Sometimes the result of a piece of work is that there is not enough evidence to say anything confidently.
That is still useful work.
The stakes can also be high. Recruitment analysis may feed into decisions worth millions. First-team reports can reach coaches shortly before a match. An unnoticed error can survive long enough to influence a discussion it should never have entered.
Working hours depend on where the role sits. Jobs attached to the first team can involve evenings, weekends and matchdays. Recruitment departments have their own peaks around transfer windows. Roles at data providers and technology companies may look more like conventional technical jobs.
Pay varies widely too. Someone with strong SQL, Python and statistical skills may be able to earn considerably more in finance, technology or another commercial industry. Football attracts a large number of applicants, and working in the sport is not automatically the financially strongest use of a technical skill set.
The appeal is different. The work can sit very close to real football decisions. An analysis may change which player a scout watches next, challenge an assumption inside the recruitment department or help a coaching staff understand something they have been seeing on the pitch.
The skills travel well if you later move elsewhere. SQL, Python, statistics, visualisation and data engineering remain useful whether the next employer is another club, a federation, a data provider, a sports technology company or an organisation outside football.
A good football data analyst eventually develops a feel for what not to analyse. They know when two players should not be compared directly, when a sample is too small and when a metric is mostly describing the team around the player. They check results that look too neat. They are comfortable saying that the evidence is weak.
Modern clubs can collect far more information than anybody needs for one decision. The job is not to put all of it into the answer. It is to work out which part deserves to be there.
Manchester City's recruitment process is a useful example because the data does not finish the story. Hundreds of thousands of players can be filtered into a manageable list. Models can identify profiles worth investigating. Tracking and physical information can reveal things that are difficult to compare consistently by eye.
The remaining players still have to be watched. Scouts still have to form opinions. Coaches still have to decide whether the player fits. Medical, contractual and financial questions still have to be answered.
For the analyst, that is the role in its proper place: giving the people making the decision better evidence to work with.


